Supermarket waiting times
From a Raspberry Pi to regional infrastructure during lockdown. In 2020, I built a map to help people check estimated waiting times at supermarkets and pharmacies. The project is now archived.
Archived project · 2020Story by Miki Lombardi
- My contribution
- I built the service and evolved it from a Raspberry Pi to regional VPS infrastructure as demand grew.
- Project context
- Contributors helped with the graphics. My preserved technical articles document the implementation and the decisions made along the way.
In pictures.
A source-derived architecture diagram, drawn in 2026 from my preserved technical article. It is not a historical product screenshot. This archived project is not a live source of waiting-time or health information.
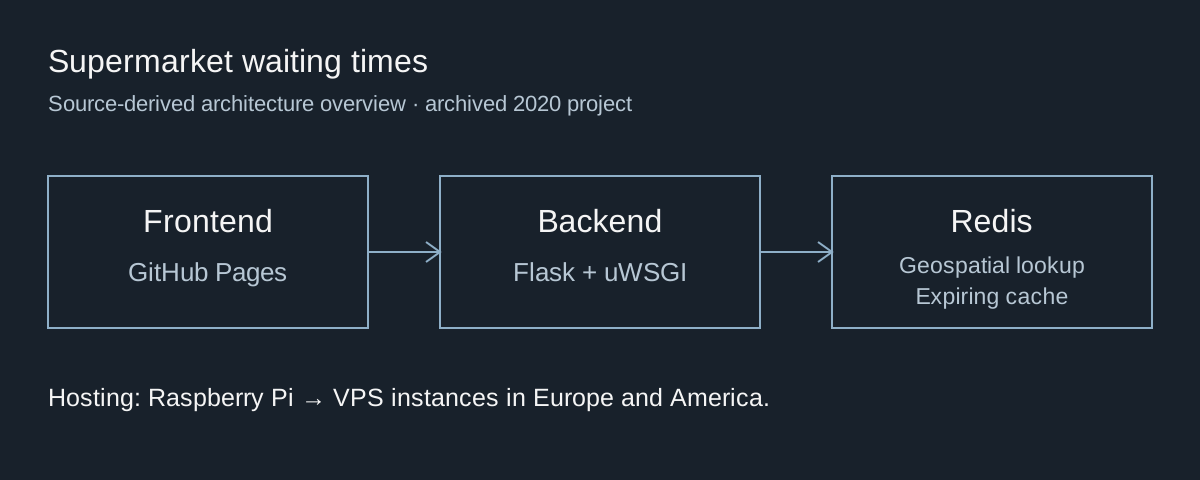
Documented architecture, drawn from the preserved technical article. This is a diagram, not a historical screenshot.
Miki Lombardi’s 2021 technical article · source-derived diagram, 2026
View full-size image: Documented architecture, drawn from the preserved technical article. This is a diagram, not a historical screenshot.
A small tool for an immediate problem
During the 2020 lockdown, a trip to the supermarket could involve a long queue. The map combined available place data with corrections from people using it, showing estimated waiting times rather than claiming to measure the queue directly.
The first version ran on my Raspberry Pi. That was an affordable starting point for a personal tool, but the same machine initially held the web services, processing and cache. As demand changed, that single setup became a constraint.
Move when the constraint becomes real
I considered extending the local setup with a cluster, then moved the backend to VPS infrastructure. Starting with the Raspberry Pi kept the initial system small; moving later meant adapting an existing service while it was being used.
The backend grew into regional instances in Europe and America, while the frontend eventually moved to GitHub Pages. Clients selected from available API instances with fallback. That approach shared the load, but also meant maintaining several environments and handling unavailable instances. It was a practical response to observed demand, rather than a claim that this was the only possible cloud architecture.
Keep location and freshness in the data layer
The backend used Python and Flask, served through uWSGI. Redis supplied geospatial lookup and expiring cached data. The frontend used Leaflet and OpenStreetMap, with a small JavaScript and Grunt setup rather than an additional application framework.
The waiting times were estimates derived from place data and feedback, with limitations when geolocation did not match the queue or venue. The service’s useful output depended on fresh data and clear expectations as much as on keeping the API available.
What the archive preserves
The source, technical articles and EuroPython talk preserve the development process. The diagram above summarises the documented architecture; it does not reconstruct a missing period map screenshot.
The lesson was adapting a personal tool to a different scale while keeping it understandable and affordable. The project remains an archived 2020 experiment. The source and archived articles preserve the reasoning behind that progression.